Building the Python Flask app – Containers as a Service (CaaS) and Serverless Computing for Containers

Deploying a Python Flask application on Knative

To understand Knative, let’s try to build and deploy a Flask application that outputs the current timestamp in the response. Let’s start by building the app.

Building the Python Flask app

We will have to create a few files to build such an app.

The app.py file looks like this:

import os

import datetime

from flask import Flask

app = Flask(__name__)

@app.route(‘/’)

def current_time():

ct = datetime.datetime.now()

return ‘The current time is : {}!\n’.format(ct)

if __name__ == “__main__”:

app.run(debug=True,host=’0.0.0.0′)

We will need the following Dockerfile to build this application:

FROM python:3.7-slim

ENV PYTHONUNBUFFERED True

ENV APP_HOME /app

WORKDIR $APP_HOME

COPY . ./

RUN pip install Flask gunicorn

CMD exec gunicorn –bind :$PORT –workers 1 –threads 8 –timeout 0 app:app

Now, let’s go ahead and build the Docker container using the following command:

$ docker build -t <your_dockerhub_user>/py-time .

Now that the image is ready, let’s push it to Docker Hub by using the following command:

$ docker push <your_dockerhub_user>/py-time

As we’ve successfully pushed the image, we can run this on Knative.

Deploying the Python Flask app on Knative

We can use the kn command line or create a manifest file to deploy the app. Use the following command to deploy the application:

$ kn service create py-time –image <your_dockerhub_user>/py-time

Creating service ‘py-time’ in namespace ‘default’:

9.412s Configuration “py-time” is waiting for a Revision to become ready.

9.652s Ingress has not yet been reconciled.

9.847s Ready to serve.

Service ‘py-time’ created to latest revision ‘py-time-00001’ is available at URL:

http://py-time.default.35.226.198.46.sslip.io

As we can see, Knative has deployed the app and provided a custom endpoint. Let’s curl the endpoint to see what we get:

$ curl http://py-time.default.35.226.198.46.sslip.io The current time is : 2023-07-03 13:30:20.804790!

We get the current time in the response. As we already know, Knative should detect whether there is no traffic coming into the pod and delete it. Let’s watch the pods for some time and see what happens:

$ kubectl get pod -w    
NAMEREADYSTATUSRESTARTSAGE
py-time-00001-deployment-jqrbk2/2Running05s
py-time-00001-deployment-jqrbk2/2Terminating064s

As we can see, just after 1 minute of inactivity, Knative starts terminating the pod. Now, that’s what we mean by scaling from zero.

To delete the service permanently, we can use the following command:

$ kn service delete py-time

We’ve just looked at the imperative way of deploying and managing the application. But what if we want to declare the configuration as we did previously? We can create a CRD manifest with the Service resource provided by apiVersion—serving.knative.dev/v1.

We will create the following manifest file, called py-time-deploy.yaml, for this:

apiVersion: serving.knative.dev/v1
kind: Service
metadata:
name: py-time
spec:
template:
spec:
containers:
image: /py-time

As we’ve created this file, we will use the kubectl CLI to apply it. It makes deployment consistent with Kubernetes.

Note

Though it is a service resource, don’t confuse this with the typical Kubernetes Service resource. It is a custom resource provided by apiVersion serving.knative.dev/ v1. That is why apiVersion is very important.

Let’s go ahead and run the following command to do so:

$ kubectl apply -f py-time-deploy.yaml

service.serving.knative.dev/py-time created

With that, the service has been created. To get the service’s endpoint, we will have to query the ksvc resource using kubectl. Run the following command to do so:

$ kubectl get ksvc py-time

NAME          URL

py-time     http://py-time.default.35.226.198.46.sslip.io

The URL is the custom endpoint we have to target. Let’s curl the custom endpoint using the following command:

$ curl http://py-time.default.35.226.198.46.sslip.io The current time is : 2023-07-03 13:30:23.345223!

We get the same response this time as well! So, if you want to keep using kubectl for managing Knative, you can easily do so.

Knative helps scale applications based on the load it receives—automatic horizontal scaling. Let’s run load testing on our application to see that in action.

Spinning up GKE – Containers as a Service (CaaS) and Serverless Computing for Containers

Once you’ve signed up and are on your console, you can open the Google Cloud Shell CLI to run the following commands.

You need to enable the GKE API first using the following command:

$ gcloud services enable container.googleapis.com

To create a two-node autoscaling GKE cluster that scales from 1 node to 5 nodes, run the following command:

$ gcloud container clusters create cluster-1 –num-nodes 2 \

–enable-autoscaling –min-nodes 1 –max-nodes 5 –zone us-central1-a

And that’s it! The cluster is up and running.

You will also need to clone the following GitHub repository for some of the exercises:

https://github.com/PacktPublishing/Modern-DevOps-Practices-2e

Run the following command to clone the repository into your home directory. Then, cd into the ch7 directory to access the required resources:

$ git clone https://github.com/PacktPublishing/Modern-DevOps-Practices-2e.git \ modern-devops

Now that the cluster is up and running, let’s go ahead and install Knative.

Installing Knative

We will install the CRDs that define Knative resources as Kubernetes API resources.

To access the resources for this section, cd into the following directory:

$ cd ~/modern-devops/ch7/knative/

Run the following command to install the CRDs:

$ kubectl apply -f \

https://github.com/knative/serving/releases/download/knative-v1.10.2/serving-crds.yaml

As we can see, Kubernetes has installed some CRDs. Next, we must install the core components of the Knative serving module. Use the following command to do so:

$ kubectl apply -f \

https://github.com/knative/serving/releases/download/knative-v1.10.2/serving-core.yaml

Now that the core serving components have been installed, the next step is installing Istio within the

Kubernetes cluster. To do so, run the following commands:

$ curl -L https://istio.io/downloadIstio | sh –

$ sudo mv istio-*/bin/istioctl /usr/local/bin

$ istioctl install –set profile=demo -y

Now that Istio has been installed, we will wait for the Istio Ingress Gateway component to be assigned an external IP address. Run the following command to check this until you get an external IP in the response:

$ kubectl -n istio-system get service istio-ingressgateway

NAME TYPE EXTERNAL-IP PORT(S) istio-ingressgteway LoadBalancer 35.226.198.46 15021,80,443

As we can see, we’ve been assigned an external IP—35.226.198.46. We will use this IP for the rest of this exercise.

Now, we will install the Knative Istio controller by using the following command:

$ kubectl apply -f \

https://github.com/knative/net-istio/releases/download/knative-v1.10.1/net-istio.yaml

Now that the controller has been installed, we must configure the DNS so that Knative can provide custom endpoints. To do so, we can use the MagicDNS solution known as sslip.io, which you can use for experimentation. The MagicDNS solution resolves any endpoint to the IP address present in the subdomain. For example, 35.226.198.46.sslip.io resolves to 35.226.198.46.

Note

Do not use MagicDNS in production. It is an experimental DNS service and should only be used for evaluating Knative.

Run the following command to configure the DNS:

$ kubectl apply -f \

https://github.com/knative/serving/releases/download/knative-v1.10.2\

/serving-default-domain.yaml

As you can see, it provides a batch job that gets fired whenever there is a DNS request.

Now, let’s install the HorizontalPodAutoscaler (HPA) add-on to automatically help us autoscale pods on the cluster with traffic. To do so, run the following command:

$ kubectl apply -f \

https://github.com/knative/serving/releases/download/knative-v1.10.2/serving-hpa.yaml

That completes our Knative installation.

Now, we need to install and configure the kn command-line utility. Use the following commands to do so:

$ sudo curl -Lo /usr/local/bin/kn \

https://github.com/knative/client/releases/download/knative-v1.10.0/kn-linux-amd64

$ sudo chmod +x /usr/local/bin/kn

In the next section, we’ll deploy our first application on Knative.

Knative architecture– Containers as a Service (CaaS) and Serverless Computing for Containers

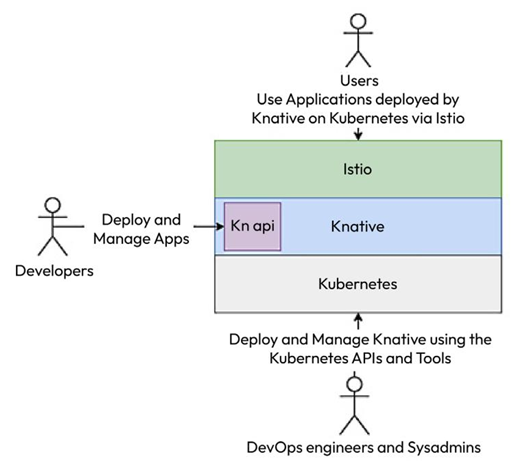
The Knative project combines elements of existing CNCF projects such as Kubernetes, Istio, Prometheus, and Grafana and eventing engines such as Kafka and Google Pub/Sub. Knative runs as a Kubernetes operator using Kubernetes Custom Resource Definitions (CRDs), which help operators administer Knative using the kubectl command line. Knative provides its API for developers, which the kn command-line utility can use. The users are provided access through Istio, which, with its traffic managementfeatures, is a crucial component of Knative. The following diagram describes

this graphically:

Figure 7.2 – Knative architecture

Knative consists of two main modules—serving and eventing. While the serving module helps us maintain stateless applications using HTTP/S endpoints, the eventing module integrates with eventing engines such as Kafka and Google Pub/Sub. As we’ve discussed mostly HTTP/S traffic, we will scope our discussion to Knative serving for this book.

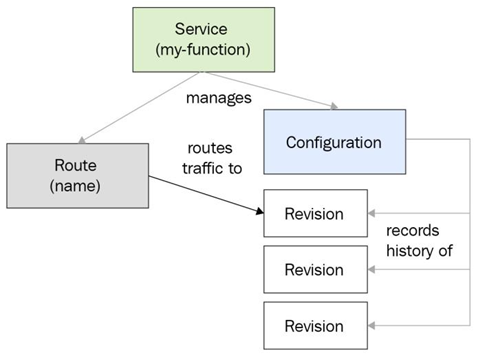
Knative maintains serving pods, which help route traffic within workload pods and act as proxies using the Istio Ingress Gateway component. It provides a virtual endpoint for your service and listens to it. When it discovers a hit on the endpoint, it creates the required Kubernetes components to serve that traffic. Therefore, Knative has the functionality to scale from zero workload pods as it will spin up a pod when it receives traffic for it. The followingdiagram shows how:

Figure 7.3 – Knative serving architecture

Knative endpoints are made up of three basic parts—<app-name>, <namespace>, and <custom-domain>. While name and namespace are similar to Kubernetes Services, custom-domain is defined by us. It can be a legitimate domain for your organization or a MagicDNS solution, such as sslip.io, which we will use in our hands-on exercises. If you are using your organization domain, you must create your DNS configuration to resolve the domain to the Istio Ingress Gateway IP addresses.

Now, let’s go ahead and install Knative.

For the exercises, we will use GKE. Since GKE is a highly robust Kubernetes cluster, it is a great choice for integrating with Knative. As mentioned previously, Google Cloud provides a free trial of $300 for 90 days. You can sign up at https://cloud.google.com/free if you’ve not done so already.

Open source CaaS with Knative – Containers as a Service (CaaS) and Serverless Computing for Containers

As we’ve seen, several vendor-specific CaaS services are available on the market. Still, the problem with most of them is that they are tied up to a single cloud provider. Our container deployment specification then becomes vendor-specific and results in vendor lock-in. As modern DevOps engineers, we must ensure that the proposed solution best fits the architecture’s needs, and avoiding vendor lock-in is one of the most important requirements.

However, Kubernetes in itself is not serverless. You must have infrastructure defined, and long-running services should have at least a single instance running at a particular time. This makes managing microservices applications a pain and resource-intensive.

But wait! We said that microservices help optimize infrastructure consumption. Yes—that’s correct, but they do so within the container space. Imagine that you have a shared cluster of VMs where parts of the application scale with traffic, and each part of the application has its peaks and troughs. Doing this will save a lot of infrastructure by performing this simple multi-tenancy.

However, it also means that you must have at least one instance of each microservice running every time—even if there is zero traffic! Well, that’s not the best utilization we have. How about creating instances when you get the first hit and not having any when you don’t have traffic? This would save a lot of resources, especially when things are silent. You can have hundreds of microservices making up the application that would not have any instances during an idle period. If you combine it with a managed service that runs Kubernetes and then autoscale your VM instances with traffic, you can have minimal instances during the silent period.

There have been attempts within the open source and cloud-native space to develop an open source, vendor-agnostic, serverless framework for containers. We have Knative for this, which the Cloud Native Computing Foundation (CNCF) has adopted.

Tip

The Cloud Run service uses Knative behind the scenes. So, if you use Google Cloud, you can use Cloud Run to use a fully managed serverless offering.

To understand how Knative works, let’s look at the Knative architecture.

Other CaaS services – Containers as a Service (CaaS) and Serverless Computing for Containers

Amazon ECS provides a versatile way of managing your container workloads. It works great when you have a smaller, simpler architecture and don’t want to add the additional overhead of using a complex container orchestration engine such as Kubernetes.

Tip

ECS is an excellent tool choice if you run exclusively on AWS and don’t have a future multi-cloud or hybrid-cloud strategy. Fargate makes deploying and running your containers easier without worrying about the infrastructure behind the scenes.

ECS is tightly coupled with AWS and its architecture. To solve this problem, we can use managed services within AWS, such as Elastic Kubernetes Service (EKS). It offers the Kubernetes API to schedule your workloads. This makes managing containers even more versatile as you can easily spin up a Kubernetes cluster and use a standard, open source solution that you can install and run anywhere you like. This does not tie you to a particular vendor. However, EKS is slightly more expensive than ECS and adds a $0.10 per hour cluster management charge. That is nothing in comparison to the benefits you get out of it.

If you aren’t running on AWS, there are options from other providers too. The next of the big three cloud providers is Azure, which offers Azure Kubernetes Service (AKS), a managed Kubernetes solution that can help you get started in minutes. AKS provides a fully managed solution with event-driven elastic provisioning for worker nodes as and when required. It also integrates nicely with Azure DevOps, giving you a faster end- to-end (E2E) development experience. As with AWS, Azure also charges $0.10 per hour for cluster management.

Google Kubernetes Engine (GKE) is one of the most robust Kubernetes platforms. Since the Kubernetes project came from Google and is the largest contributor to this project in the open source community, GKE is generally quicker to roll out newer versions and is the first to release security patches into the solution. Also, it is one of the most feature-rich with customizable solutions and offers several plugins as a cluster configuration. Therefore, you can choose what to install on Bootstrap and further harden your cluster. However, all these come at a cost, as GKE charges a $0.10 cluster management charge per hour, just like AWS and Azure.

You can use Google Cloud Run if you don’t want to use Kubernetes if your architecture is not complicated, and there are only a few containers to manage. Google Cloud Run is a serverless CaaS solution built on the open source Knative project. It helps you run your containers without any vendor lock-in. Since it is serverless, you only pay for the number of containers you use and their resource utilization. It is a fully scalable and well-integrated solution with Google Cloud’s DevOps and monitoring solutions such as Cloud Code, Cloud Build, Cloud Monitoring, and Cloud Logging. The best part is that it is comparable to AWS Fargate and abstracts all infrastructure behind the scenes. So, it’s a minimal Ops or NoOps solution.

Now that we’ve mentioned Knative as an open source CaaS solution, let’s discuss it in more detail.

Deleting an ECS service – Containers as a Service (CaaS) and Serverless Computing for Containers

To delete the service, run the following command:

$ ecs-cli compose service down –cluster cluster-1

INFO[0001] Deleted ECS service service=FARGATE

INFO[0001] Service status desiredCount=0 runningCount=1 serviceName=FARGATE INFO[0006] Service status desiredCount=0 runningCount=0 serviceName=FARGATE INFO[0006] (service FARGATE) has stopped 1 running tasks: (task 9b48084d11cf49be85141fd9bfe9e1c3). timestamp=”2023-07-03 11:34:10 +0000 UTC” INFO[0006] ECS Service has reached a stable state desiredCount=0 runningCount=0 serviceName=FARGATE

As we can see, the service has been deleted.

Note that even if we create multiple instances of tasks, they run on different IP addresses and can be

accessed separately. However, tasks need to be load-balanced, and we need to provide a single endpoint.

Let’s look at a solution we can use to manage this.

Load balancing containers running on ECS

Load balancing is an essential functionality of multi-instance applications. They help us serve the application on a single endpoint. Therefore, you can have multiple instances of your applications

running simultaneously, and the end user doesn’t need to worry about which instance they’re calling. AWS provides two main load-balancing solutions—Layer 4 with the Network Load Balancer (NLB) and Layer 7 with the Application Load Balancer (ALB).

Tip

While both load balancers have their use cases, a Layer 7 load balancer provides a significant advantage for HTTP-based applications. It offers advanced traffic management, such as path-based and host-based routing.

So, let’s go ahead and create an ALB to frontend our tasks using the following command:

$ aws elbv2 create-load-balancer –name ecs-alb –subnets <SUBNET-1> <SUBNET-2> \ –security-groups <SECURITY_GROUP_ID> –region us-east-1

The output of the preceding command contains values for LoadBalancerARN and DNSName. We will need to use them in the subsequent steps, so keep a copy of the output safe.

The next step will be to create a target group. The target group defines the group of tasks and the port they will be listening to, and the load balancer will forward traffic to it. Use the following command to define a target group:

$ aws elbv2 create-target-group –name target-group –protocol HTTP \

–port 80 –target-type ip –vpc-id <VPC_ID> –region us-east-1

You will get the targetGroupARN value in the response. Keep it safe, as we will need it in the next step.

Next, we will need a listener running on the load balancer. This shouldforward traffic from the load balancer to the target group. Use the following command to do so:

$ aws elbv2 create-listener –load-balancer-arn <LOAD_BALANCER_ARN> \ –protocol HTTP –port 80 \

–default-actions Type=forward,TargetGroupArn=<TARGET_GROUP_ARN> \ –region us-east-1

You will get the listenerARN value in response to this command. Please keep that handy; we will need it in the next step.

Now that we’ve defined the load balancer, we need to run ecs-cli compose service up to deploy our service. We will also provide the target group as a parameter to associate our service with the load balancer.

To access the resources for this section, cd into the following directory:

$ cd ~/modern-devops/ch7/ECS/loadbalancing/

Run the following command to do so:

$ ecs-cli compose service up –create-log-groups –cluster cluster-1 \ –launch-type FARGATE –target-group-arn <TARGET_GROUP_ARN> \ –container-name web –container-port 80

Now that the service and our task are running on Fargate, we can scale our service to three desired tasks. To do so, run the following command:

$ ecs-cli compose service scale 3 –cluster cluster-1

Since our service has scaled to three tasks, let’s go ahead and hit the load balancer DNS endpoint we captured in the first step. This should provide us with the defaultnginx response. Run the following command to do so:

$ curl ecs-alb-1660189891.us-east-1.elb.amazonaws.com

<html>

<head>

<title>Welcome to nginx!</title>

</html>

As we can see, we get a default nginx response from the load balancer. This shows that load balancing is working well!

ECS provides a host of other features, such as horizontal autoscaling, customizable task placement algorithms, and others, but they are beyond the scope of this book. Please read the ECS documentation to learn more about other aspects of the tool. Now, let’s look at other popular CaaS products available on the market.

Scheduling services on ECS – Containers as a Service (CaaS) and Serverless Computing for Containers

ECS services are similar to Kubernetes ReplicaSets. They ensure that a certain number of tasks are always running at a particular time. To schedule a service, we can use the ecs-cli command line.

Tip

Always use services for applications that are long-running, such as web servers. For batch jobs, always use tasks, as we don’t want to recreate the job after it ends.

To run the nginx web server as a service, we can use the following command:

$ ecs-cli compose service up –create-log-groups \

–cluster cluster-1 –launch-type FARGATE

INFO[0001] Using ECS task definition TaskDefinition=”FARGATE:1″

INFO[0002] Auto-enabling ECS Managed Tags

INFO[0013] (service FARGATE) has started 1 tasks: (task 9b48084d).   timestamp=”2023-07-03

11:24:42 +0000 UTC”

INFO[0029] Service status desiredCount=1 runningCount=1 serviceName=FARGATE

INFO[0029] (service FARGATE) has reached a steady state. timestamp=”2023-07-03 11:25:00 +0000 UTC”

INFO[0029] (service FARGATE) (deployment ecs-svc/94284856) deployment completed. timestamp=”2023-07-03 11:25:00 UTC”

INFO[0029] ECS Service has reached a stable state desiredCount=1 runningCount=1 serviceName=FARGATE

INFO[0029] Created an ECS service service=FARGATE taskDefinition=”FARGATE:1″

Looking at the logs, we can see that the service is trying to ensure that the task’s desired count matches the task’s running count. If your task is deleted, ECS will replace it with a new one.

Let’s list the tasks and see what we get by using the following command:

$ ecs-cli ps –cluster cluster-1 Name State Ports cluster-1/9b48084d/web RUNNING 18.234.123.71:80

TaskDefinition

FARGATE:1

As we can see, the service has created a new task that is running on 18.234.123.71:80. Let’s try to access this URL using the following command:

$ curl 18.234.123.71

<!DOCTYPE html>

<html>

<head>

<title>Welcome to nginx!</title>

</html>

We get the default nginx home page in the response. Now, let’s try to browse the logs of the task.

Browsing container logs using the ECS CLI

Apart from using Amazon CloudWatch, you can also use the friendly ECS CLI to do this, irrespective of where your logs are stored. This helps us see everything from a single pane of glass.

Run the following command to do so:

$ ecs-cli logs –task-id 9b48084d –cluster cluster-1 /docker-entrypoint.sh: /docker-entrypoint.d/ is not empty, will attempt to perform configuration

/docker-entrypoint.sh: Launching /docker-entrypoint.d/10-listen-on-ipv6-by-default.sh 10-listen-on-ipv6-by-default.sh: info: Enabled listen on IPv6 in /etc/nginx/conf.d/ default.conf

/docker-entrypoint.sh: Launching /docker-entrypoint.d/20-envsubst-on-templates.sh

/docker-entrypoint.sh: Launching /docker-entrypoint.d/30-tune-worker-processes.sh

/docker-entrypoint.sh: Configuration complete; ready for start up

2023/07/03 11:24:57 [notice] 1#1: nginx/1.25.1

2023/07/03 11:24:57 [notice] 1#1: built by gcc 12.2.0 (Debian 12.2.0-14)

2023/07/03 11:24:57 [notice] 1#1: OS: Linux 5.10.184-175.731.amzn2.x86_64

2023/07/03 11:24:57 [notice] 1#1: getrlimit(RLIMIT_NOFILE): 65535:65535

2023/07/03 11:24:57 [notice] 1#1: start worker processes

2023/07/03 11:24:57 [notice] 1#1: start worker process 29

2023/07/03 11:24:57 [notice] 1#1: start worker process 30

13.232.8.130 – – [03/Jul/2023:11:30:38 +0000] “GET / HTTP/1.1” 200 615 “-” “curl/7.81.0”

“-“

As we can see, we can browse the logs for the particular task this service is running. Now, let’s go ahead and delete the service.

Scheduling Fargate tasks on ECS – Containers as a Service (CaaS) and Serverless Computing for Containers

Scheduling tasks on Fargate is very similar to EC2. Here, we need to specify the launch-type value as FARGATE.

To schedule the same task on Fargate, run the following command:

$ ecs-cli compose up –create-log-groups –cluster cluster-1 –launch-type FARGATE FATA[0001] ClientException: Fargate only supports network mode ‘awsvpc’.

Oops! We have a problem! Well, it’s complaining about the network type. For a Fargate task, we must supply the network type as awsvpc instead of the default bridge network. The awsvpc network is an overlay network that implements the Container Network Interface (CNI). To understand more about Docker networking, please refer to Chapter 1, The Modern Way of DevOps. For now, let’s go ahead and configure the awsvpc network type. But before that, the Fargate task requires a few configurations.

To access the resources for this section, cd into the following directory:

$ cd ~/modern-devops/ch7/ECS/tasks/FARGATE/

First, we’ll have to assume a task execution role for the ECS agent to authenticate with the AWS API and interact with Fargate.

To do so, create the following task-execution-assume-role.json file:

{
“Version”: “2012-10-17”,
“Statement”: [
{
“Sid”: “”,
“Effect”: “Allow”,
“Principal”: {
“Service”: “ecs-tasks.amazonaws.com”
},
“Action”: “sts:AssumeRole”
}
]
}

Then, use the following command to assume the task execution role:

$ aws iam –region us-east-1 create-role –role-name ecsTaskExecutionRole \ –assume-role-policy-document file://task-execution-assume-role.json

ECS provides a default role policy called AmazonECSTaskExecutionRolePolicy, which contains various permissions that help you interact with CloudWatch and Elastic Container Registry (ECR). The following JSON code outlines the permission that the policy has:

{
“Version”: “2012-10-17”,
“Statement”: [
{
“Effect”: “Allow”,
“Action”: [
“ecr:GetAuthorizationToken”,
“ecr:BatchCheckLayerAvailability”,
“ecr:GetDownloadUrlForLayer”,
“ecr:BatchGetImage”,
“logs:CreateLogStream”,
“logs:PutLogEvents”
],
“Resource”: “*”
}
]
}

We have to assign this role policy to the ecsTaskExecution role we assumed previously by using the following command:

$ aws iam attach-role-policy \

–policy-arn arn:aws:iam::aws:policy/service-role/AmazonECSTaskExecutionRolePolicy \ –role-name ecsTaskExecutionRole

Once we’ve assigned the policy to the ecsTaskExecution role, we need to source the ID of both subnets and the security group of the ECS cluster when we created it. You can find those details in the command-line output from when we created the cluster. We will use these details in the following ecs-params.yml file:

version: 1
task_definition:
task_execution_role: ecsTaskExecutionRole
ecs_network_mode: awsvpc
task_size:
mem_limit: 0.5GB
cpu_limit: 256
run_params:
network_configuration:
awsvpc_configuration:
subnets:
“subnet-088b52c91a6f40fd7”
“subnet-032cd63290da67271” security_groups:
“sg-097206175813aa7e7” assign_public_ip: ENABLED

The ecs-params.yml file consists of task_execution_role, which we created, and ecs_ network_mode set to awsvpc, as Fargate requires. We’ve defined task_size to have 0.5GB of memory and 256 millicores of CPU. So, since Fargate is a serverless solution, we only pay for the CPU cores and memory we consume. The run_params section consists of network_configuration, which contains awsvpc_configuration. Here, we specify both subnets created when we created the ECS cluster. We must also specify security_groups, which we created with the ECS cluster.

Note

Use the subnets and security groups of your ECS cluster instead of copying the ones in this example.

Now that we’re ready to fire the task on Fargate, let’s run the following command:

$ ecs-cli compose up –create-log-groups –cluster cluster-1 –launch-type FARGATE

Now, let’s check whether the task is running successfully by using the following command:

$ ecs-cli ps –cluster cluster-1 Name State cluster-1/8717a149/web RUNNING
Ports                   TaskDefinition
3.80.173.230:80 FARGATE:1

As we can see, the task is running on 3.80.173.230:80 as a Fargate task. Let’s curl this URL to see whether we get a response by using the following command:

$ curl 3.80.173.230:80
Welcome to nginx! …

As we can see, we get the default nginx home page.

Now, let’s go ahead and delete the task we created by using the following command:

$ ecs-cli compose down –cluster cluster-1

As we already know, tasks have a set life cycle, and once they stop, they stop. You cannot start the same task again. Therefore, we must create a service to ensure that a certain number of tasks are always running. We’ll create a service in the next section.

Scheduling EC2 tasks on ECS – Containers as a Service (CaaS) and Serverless Computing for Containers

Let’s use ecs-cli to apply the configuration and schedule our task using the following command:

$ ecs-cli compose up –create-log-groups –cluster cluster-1 –launch-type EC2

Now that the task has been scheduled and the container is running, let’s list all the tasks to get the container’s details and find out where it is running. To do so, run the following command:

$ ecs-cli ps –cluster cluster-1

Name                                   State       Ports                            TaskDefinition

cluster-1/fee1cf28/web  RUNNING  34.237.218.7:80->80  EC2:1

As we can see, the web container is running on cluster-1 on 34.237.218.7:80. Now, use the following command to curl this endpoint to see what we get:

$ curl 34.237.218.7:80

<html>

<head>

<title>Welcome to nginx!</title>

</html>

Here, we get the default nginx home page! We’ve successfully scheduled a container on ECS using the EC2 launch type. You might want to duplicate this task to handle more traffic. This is known as horizontal scaling. We’ll see how in the next section.

Scaling tasks

We can easily scale tasks using ecs-cli. Use the following command to scale the tasks to 2:

$ ecs-cli compose scale 2 –cluster cluster-1 –launch-type EC2

Now, use the following command to check whether two containers are running on the cluster:

$ ecs-cli ps –cluster cluster-1  
NameStatePortsTaskDefinition
cluster-1/b43bdec7/webRUNNING54.90.208.183:80->80EC2:1
cluster-1/fee1cf28/webRUNNING34.237.218.7:80->80EC2:1

As we can see, two containers are running on the cluster. Now, let’s query CloudWatch to get the logs of the containers.

Querying container logs from CloudWatch

To query logs from CloudWatch, we must list the log streams using the following command:

$ aws logs describe-log-streams –log-group-name /aws/webserver \ –log-stream-name-prefix ecs | grep logStreamName

“logStreamName”: “ecs/web/b43bdec7”,

“logStreamName”: “ecs/web/fee1cf28”,

As we can see, there are two log streams for this—one for each task. logStreamName follows the convention <log_stream_prefix>/<task_name>/<task_id>. So, to get the logs for ecs/ b43bdec7/web, run the following command:

$ aws logs get-log-events –log-group-name/aws/webserver \ –log-stream ecs/web/b43bdec7

Here, you will see a stream of logs in JSON format in the response. Now, let’s look at how we can stop running tasks.

Stopping tasks

ecs-cli uses the friendly docker-compose syntax for everything. Use the following command to stop the tasks in the cluster:

$ ecs-cli compose down –cluster cluster-1

Let’s list the containers to see whether the tasks have stopped by using the following command:

$ ecs-cli ps –cluster cluster-1

INFO[0001] Stopping container… container=cluster-1/b43bdec7/web INFO[0001] Stopping container… container=cluster-1/fee1cf28/web INFO[0008] Stopped container… container=cluster-1/b43bdec7/web desiredStatus=STOPPED lastStatus=STOPPED taskDefinition=”EC2:1″ INFO[0008] Stopped container… container=cluster-1/fee1cf28/web desiredStatus=STOPPED lastStatus=STOPPED taskDefinition=”EC2:1″

As we can see, both containers have stopped.

Running tasks on EC2 is not a serverless way of doing things. You still have to provision and manage the EC2 instances, and although ECS manages workloads on the cluster, you still have to pay for the amount of resources you’ve provisioned in the form of EC2 instances. AWS offers Fargate as a serverless solution where you pay per resource consumption. Let’s look at how we can create the same task as a Fargate task.

Creating task definitions – Containers as a Service (CaaS) and Serverless Computing for Containers

ECS tasks are similar to Kubernetes pods. They are the basic building blocks of ECS and comprise one or more related containers. Task definitions are the blueprints for ECS tasks and define what the ECS task should look like. They are very similar to docker-compose files and are written in YAML format. ECS also uses all versions of docker-compose to allow us to define tasks. They help you define containers and their images, resource requirements, where they should run (EC2 or Fargate), volume and port mappings, and other networking requirements.

Tip

Using the docker-compose manifest to spin up tasks and services is a great idea, as it will help you align your configuration with an open standard.

A task is a finite process and only runs once. Even if it’s a long-running process, such as a web server, the task still runs once as it waits for the long-running process to end (which runs indefinitely in theory). The task’s life cycle follows the Pending -> Running -> Stopped states. So, when you schedule your task, the task enters the Pending state, attempting to pull the image from the container registry. Then, it tries to start the container. Once the container has started, it enters the Running state. When the container has completed executing or errored out, it ends up in the Stopped state. A container with startup errors directly transitions from the Pending state to the Stopped state.

Now, let’s go ahead and deploy an nginx web server task within the ECS cluster we just created.

To access the resources for this section, cd into the following directory:

$ cd ~/modern-devops/ch7/ECS/tasks/EC2/

We’ll use docker-compose task definitions here. So, let’s start by defining the following docker-compose.yml file:

version: ‘3’
services:
web:
image: nginx
ports:
“80:80”
logging: driver: awslogs options:
awslogs-group: /aws/webserver
awslogs-region: us-east-1
awslogs-stream-prefix: ecs

The YAML file defines a web container with an nginx image with host port 80 mapped to container port 80. It uses the awslogs logging driver, which streams logs into Amazon CloudWatch. It will stream the logs to the /aws/webserver log group in the us-east-1 region with the ecs stream prefix.

The task definition also includes the resource definition—that is, the amount of resources we want to reserve for our task. Therefore, we will have to define the following ecs-params.yaml file:

version: 1
task_definition:
services:
web:
cpu_shares: 100
mem_limit: 524288000

This YAML file defines cpu_shares in millicores and mem_limit in bytes for the container we plan to fire. Now, let’s look at scheduling this task as an EC2 task.